
This article is published in the Case Study category.
Inspired by Thailand’s trendy night market culture, the ArtBox market has reached Singapore this April. Making a lot of noise on the social media and in the press, the Singaporean version of this indie flea market is a great popular success, mixing concerts, handicraft, designer shops and foodie stalls. Overwhelmed by its success, the hip market has even been criticised by some for its huge number of visitors and the difficulty to visit all the booths on the first day.
Specialised in Crowd Analytics, DFRC has installed its crowd monitoring system at Bayfront, where the ArtBox market is located, and analysed with great interest the visitors’ behaviour patterns. Based on mobile phone signals detection, the LBASense sensors are capable of tracing precise visitor activity figures, hour-by-hour and day-by-day, by aggregating anonymous mobile phone data.
As shown in the graph below, during the first weekend of the event, the first day, Saturday April 15th, was the most popular, with a peak of visitors at 7:00 PM.
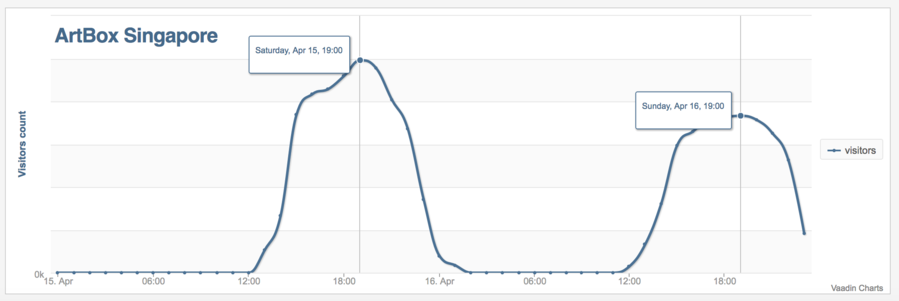
By analysing the crowd’s behaviour during opening hours, over the two days of the event, from 3:00 PM to 11:00 PM, it was clear that visitors kept on arriving until early evening, around 7:00 PM, on both days; whereas they started leaving after, making the time frame between 8:00 PM and 10:00 PM the most comfortable time to visit the market, in a quieter and more relaxed atmosphere.
Organisers have looked at the crowd analytics’ results and advised consequently visitors since the first day to choose the less crowded hours to visit the market, just like shown by DFRC Crowd Analytics’ data.
Data from the second weekend shows that the Saturday was again the most popular day among visitors, but that unlike on April 15th, the peak hour was at 8:00 PM. On Sunday, fewer visitors were detected and the most popular time was 6:00 PM. The difference in the peak hours could indicate that the organisers’ suggestion made the week before to visit the site during quieter hours has been heard.
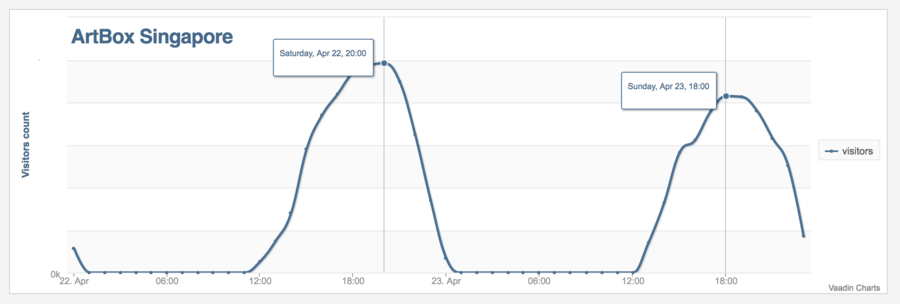
Results from our analysis show that during both weekends, Saturdays have been the most popular days.
Although these results could seem unsurprising, they are very useful for event organisers, advertisers, artists or for businesses willing to rent a booth. Thanks to Crowd Analytics, a rent price or a contract can be negotiated according to the day and/or time expected to generate the most revenue.
If you wish to monitor your event with LBASense Crowd Analytics system, contact us.
Data team
Copyright © 2022 DFRC
43 Science Park Road #01-11 Rm 8, Singapore 117408