
This article is published in the News category.
DFRC has released, in February 2020, the latest version of its LBASense Insights mobile app allowing clients operating the LBASense Crowd Analytics system to easily access their real-time and historical data from anywhere via their mobile phone or tablet.
The main features available, via the LBASense Insights Mobile App, are real-time data, visitor count, SAP history, daily and monthly visitor count, duration of stay, alert setup, pinpoint registration and sensor health. The mobile app is free, available for Android and iOS operating systems and also includes a demo mode.
The LBASense Insights’ “Real Time” tab presents the current number of visitors on a monitored site, where LBASense detectors have been deployed. The pie graph is divided into regions (areas monitored by one sensor) from a particular site, showing the visitor count for each specific region. Comparing regions is a useful feature, for example, to understand which part of a venue is the most popular or how a crowd is occupying a public area such as a park.
The “SAP History” tab displays the visitor count hourly in a specific site, in intervals of 5 minutes, with the possibility of querying data up to the last 30 days. Further, upon selection of a specific point, it is possible via this feature, to view the highest value (number of people) within the selected 5 minutes.
A colour combination indicates how crowded the region is with ‘yellow’ being the least crowded and ‘red’ the highest number of crowd at that point in time.
The SAP feature can be an interesting tool to monitor safety and visualize a huge crowd present in a critical infrastructure such as on a bridge during public events for example.
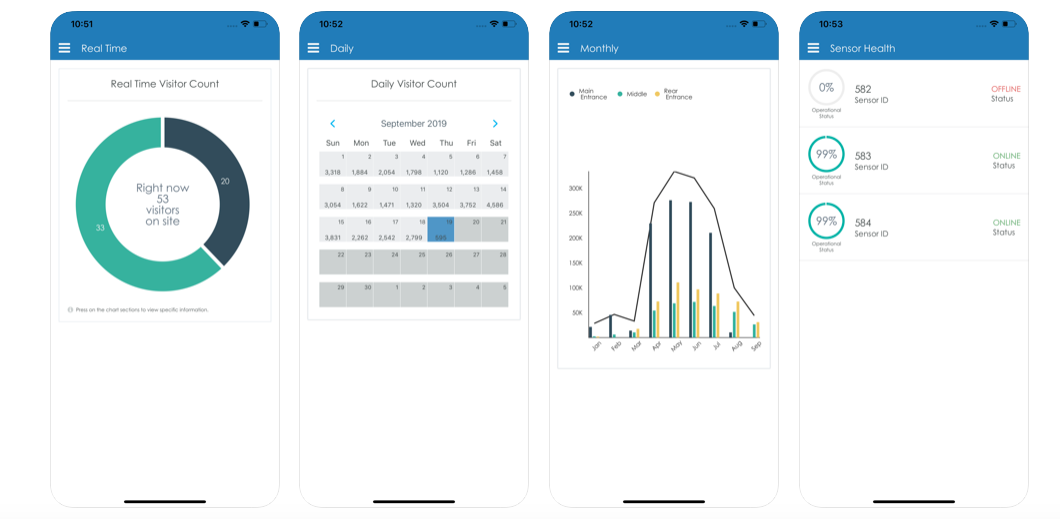
The ‘Daily Visitor Count’ tab shows the number of visitors for that particular month displayed in a calendar format. The highlighted day indicates the present day. The ’Monthly Visitor Count’ tab shows the visitor count for each month. The individual bar graphs displays the count for each specific region. The Calendar view is a great feature to compare trends weeks over weeks, or during weekdays versus weekends.
The “Duration” tab displays the visitor count in a specific region based on the visitors’ duration of stay. Very popular during events, the duration feature allows understanding how good an event planner is at retaining visitors.
The “Alert Setup” tab allows you to set up alarms for the chosen site. Once notifications are allowed under the phone settings, the user is then able to set up alerts, relative to the detection of registered users for example. Such a feature can be used for productivity management, VIP marketing campaigns or to detect a device present in a restricted area, for example, by showing activity in a site closed at night.
In the “PinPoint” feature, the “Real Time” tab displays the list of visitors (All visitors, Registered & Not registered) that are detected in a previously set range. Clicking on the specific visitor will show further details.
The “History” tab allows seeing the list of visitors based on the set time filters. Lastly, the “Registered” tab only displays the list of visitors that have been registered to the system via the captive portal.
Registering users to a captive portal is an interesting feature allowing to create specific marketing campaigns targeting selected audiences. Nevertheless, the PinPoint feature’s main goal is security: to detect unauthorized activity on a monitored site.
Lastly, the “sensor health” tab allows monitoring sensors’ connectivity status.
Interested in deploying LBASense sensors in your city? Contact us for a tailored offer.
PR team
Copyright © 2022 DFRC
43 Science Park Road #01-11 Rm 8, Singapore 117408