This article is published in the Case Study category.
Find The Best Location With Crowd Analytics
When deciding of a location for a new business, many factors need to be taken into consideration. Depending on the potential target market, or for example the mean of transportation customers will use (will they come by car, by foot, by public transportation), the location selection nevertheless remains the key to success and Crowd Analytics can provide useful insights on this matter.
.
Analysing a city’s human pattern
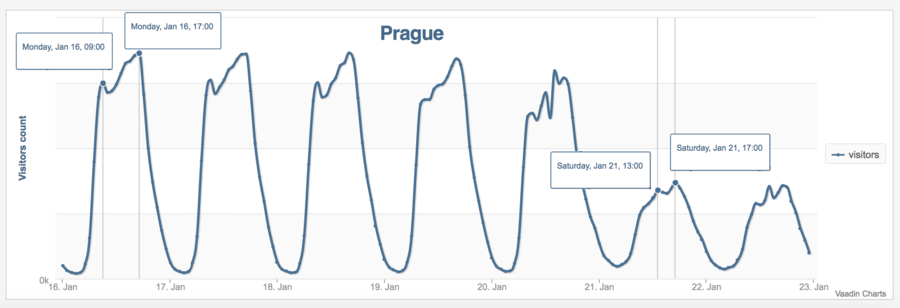
Crowd Analytics aim at reflecting as much as possible the real human footprint of a neighbourhood or a street. Based on passive mobile phone tracking systems, they allow to understand how many people pass by a specific location per minute, hour, day and so on. More than just showing numbers, graphs of population patterns show the citizens’ habits. At what time do people usually enter the city centre to reach work? When do they go out for lunch, and when do they commute home? Here below, a screenshot from our installation in Prague represents a typical weekly pattern: the city is busy when citizens go to work and quieter on weekends.
Prague Typical Weekly Pattern, Useful Data When Comparing Two Potential Locations
An entrepreneur who plans to open his shop has of course already an idea where the best location in the city would be. The area where similar businesses and possible competitors are is probably the best: he/she has more chances to reach the correct target population. Nevertheless Crowd Analytics are again a handy tool to compare in a very precise manner the success among visitors of different locations in a close perimeter.
.
Up-to-the-minute Data
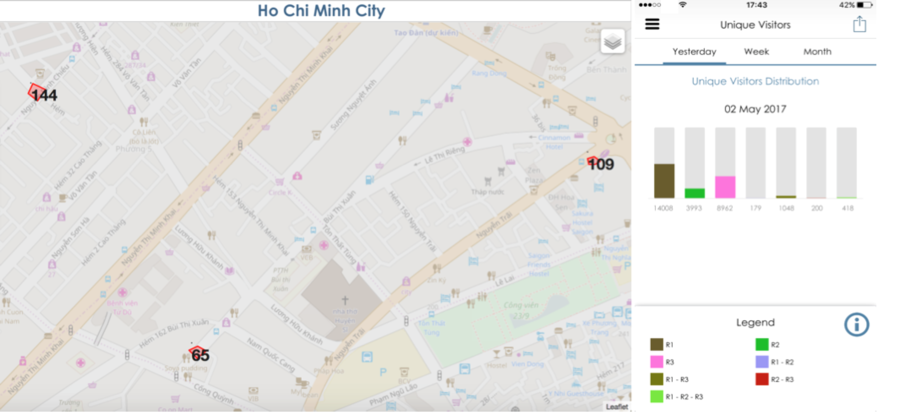
As shown from our sensors in Ho Chi Minh City in the image below, the Situation Awareness Picture presents the number of real time passers-by, per minute, in each location. Numbers make sense in a context, so according to the time of the day and day of the week, in-depth analysis must be carried on.
Thanks to the Unique Visitor’s analytics, a chainstore owner willing to open a new branch can also compare the unique visitors in each location (unique visitors in R1, then in R2 and then in R3) and in the combination of them. He will in fact also understand if the customers visiting the new shop location – R3 – are mostly new customers or the same customers as the two other shops, which could mean that the investment made to open the new branch was not useful.
SAP view of Ho Chi Minh City and Unique Visitors Graph. Unique Visitors are persons detected only in one region (R1, or R2, or R3) or in combined regions (in R1 and R3; or in R1, R2 and R3; or in R1 and R2; or in R2 and R3).
More crowd analytics also show the visitors’ duration of stay, the percentage of returning visitors compared to the newcomers and soon the demographics (age and gender). Very simple to implement, as all data are aggregated and no private data are used, passers-by don’t need to do anything: the system is entirely passive and does not require any action (such as downloading an app) from the citizens.
.
Economic impacts of Crowd Analytics for Finding the Best Location
Knowing a location’s exact traffic, whether the results are satisfactory or not, can offer strong negotiation tools to discuss the price of a rent for a stall in a market, for example, or of a coffee shop in a mall.
Branch owners have also the possibility to compare their restaurants and annual turnovers, or to understand how to be more effective at reaching out the passers-by who are actually not entering their shop.
.
If you wish to analyse your visitors with the LBASense Crowd Analytics system, contact us.